This page contains links to the Data Master 2000 screenshots and illustrates
various features of Data Master 2000.
|
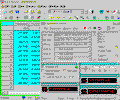 |
Several experimental facilities were successfully automated with DM2000 (including
low-temperature spectroscopic and galvanomagnetic measurements). This picture demonstrates
real data acquisition process: resistivity of carbyne samples measured in the wide
temperature range from room to liquid helium temperatures. Data from experimental hardware
recorded by special application running in the foreground window (see more details about data acquisition). |
|
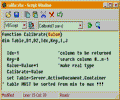 |
DM2000 includes two special windows that can utilize Windows scripting engines: minibrowser (scripts are invoked from HTML code) and script window. This tool especially convenient for debugging
purposes: you can compile script and simply run selected procedure. Notice that more
powerful and convenient script debuggers included in various Microsoft products. |
|
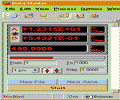 |
DM2000 exposes its object model to any COM-compatible automation controller. For
example, this screenshot demonstrates how to run HTML and script - based applications
within DM2000 minibrowser window. This application
("scriptlet") can contain various UI controls, including ActiveX instrument
drivers, and it has access to DM2000 windows, worksheets, data elements etc. See also Impedancemeter simulator page. |
|
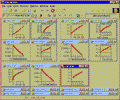 |
This project contains conductivity and TEMF data for a series of quenched under high
pressure carbyne samples. Sig(T) and TEMF(T) curves may be decomposed into several
contributions with the specific nonlinear fitting procedure
(see also next picture). |
|
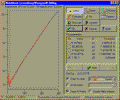 |
DM2000 includes 3 fitters: one linear
("exact" fitting: parameters calculated by solving a system of linear equations)
and two non-linear (iterative, Levenberg-Marquardt algorithm):
for arbitrary function and for lorentzian peaks (calculates initial parameter
approximations). You have full control over the fitting session: you can manually set
parameter values, fit only selected points, and do many other things. |
|
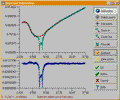 |
Microwave transmission spectrometer uses low-temperature bolometer instead of resonator
cavity. This feature allows wide-band frequency measurements (typically 20-120 GHz
for our generators), but the base lines for field scans become more complex. Usually it is
necessary to subtract base line from MW transmission (or absorption) spectra for future fitting (see above). This picture demonstrates base line subtraction tool: you can see original curve (green,
top pane), cubic spline calculated by manually created points (red) and result plot
(bottom pane, blue) of subtracted spectra. |
|
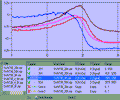 |
Plot series manager window works as a detailed plot
legend and allows user to apply standard Copy/Paste/Cut/Delete
commands on the list of Series objects. With this tool, series management becomes more
convenient, intuitive and "object-oriented". |
|
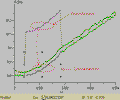 |
When you work with electrical contacts in the wide temperature range (1.7-300 K)
you may frequently observe various contact instabilities. Sometimes your data seems to be
multiplied by (approximately) constant factor, or linearly displaced, as shown at this
picture. In this case you may easily "repair" your curve with curve translation tool: just select "bad" points and drag
them at the right place. |
|
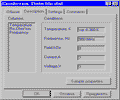 |
MetaBase software briefly described at the MetaBase User's guide
page. This picture illustrates how DM2000 MetaBase can interact with Windows shell:
right-click associated with property page handler file icon, select "Properties"
from the popup menu and get full information about this file. Note that property pages
constructed manually from resources in DM2000 application. |
|
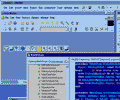 |
This picture illustrates development process with Delphi 6. You can see opened
DM2000 main form, appropriate *.pas file loaded into editor window and code explorer.
Enjoy! |
|
 |
Note that DM2000 project has a long history: it was started at 1993! That's why its
current version is 10.x. |


