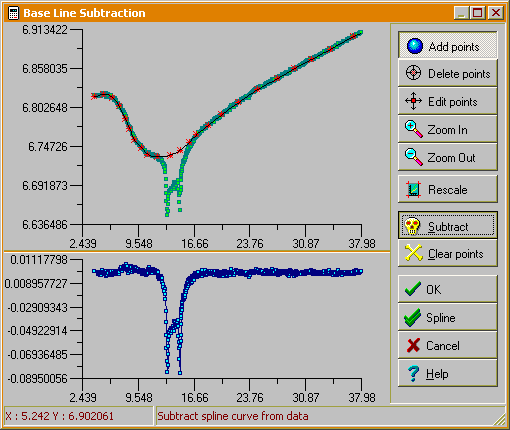
Sometimes in the spectroscopic applications parasitic featureless base line is superimposed over useful signal from the measured sample. In this case you may need to subtract this base line manually from the measured spectrum. With DM2000 it is very easy because it includes specially designed tool - Base Line Subtractor window (see picture below).

How to use Base Line Subtractor? First you should plot data to be processed (this tool works only with active plot serie). Then make plot active and select Process|Base Line menu item to display Base Line Subtractor window. You will see your curve on the top plot. Instead of drawing base line you should add some amount of node points (at least six) that will belong to the base line and then create standard cubic spline curve that connects defined points by clicking "Subtract" button. After subtracting spline from given curve bottom plot will show the result of the subtraction. You can add this residual curve to the worksheet referenced by active serie if you click OK button or add spline curve itself if you click "Spline" button.
Base Line Subtractor window gives you a wide set of options that make it very convenient:
Note that OK and "Spline" buttons are disabled until you create valid base line.